
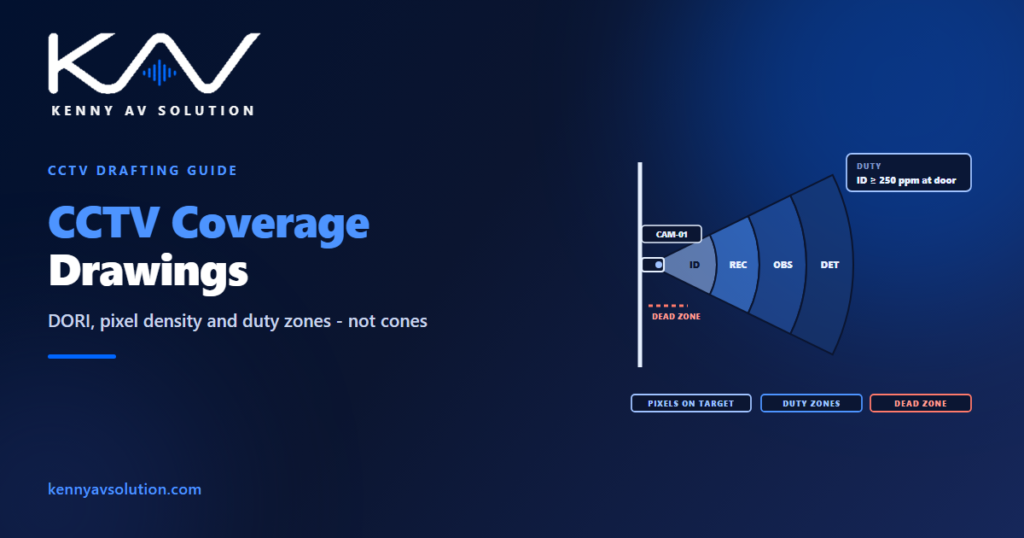
CCTV coverage drawings are often drawn as cones: a camera symbol with a wedge spreading across the plan, and the room looking safely covered. The wedge says almost nothing. What matters is whether the camera puts enough pixels on the target to do its job — to see that someone is there, to recognise them, or to identify them — and that depends on resolution, lens and distance, not on the shape of the cone.
Privacy and data protection rules for surveillance vary by country and by use, and some sites have their own security standards. Confirm what applies with the client before the design is fixed.
Agree the criteria before drawing the first camera
A coverage drawing that gets rejected is usually rejected over criteria, not over drafting. Settle them first, in writing, on the drawing.
The common reference is IEC 62676-4, which describes performance in terms of pixel density on the target, usually expressed as pixels per metre (ppm). The 2015 edition’s widely used levels — known as DORI — are:
- Detection — 25 ppm: you can see that a person is present.
- Observation — 62 ppm: you can see what they are doing.
- Recognition — 125 ppm: you can tell whether it is someone you know.
- Identification — 250 ppm: enough detail to identify a stranger.
The standard also defines lower and higher levels, and a 2025 revision introduced different names for its categories. Use one set of terms consistently in a document; mixing editions is a common source of confusion. Some clients and countries use their own criteria, often in pixels per foot — divide pixels per metre by 3.28 to convert.
Then give every camera a duty: what it must achieve, on what target, at what distance. “Identification at the main entrance door” is a duty. “Covers the lobby” is not.
Pixel density fixes the width; the lens only sets the distance
The arithmetic is short. Pixel density is the camera’s horizontal resolution divided by the width of its field of view at the target:
ppm = horizontal pixels ÷ field-of-view width at the target (m)
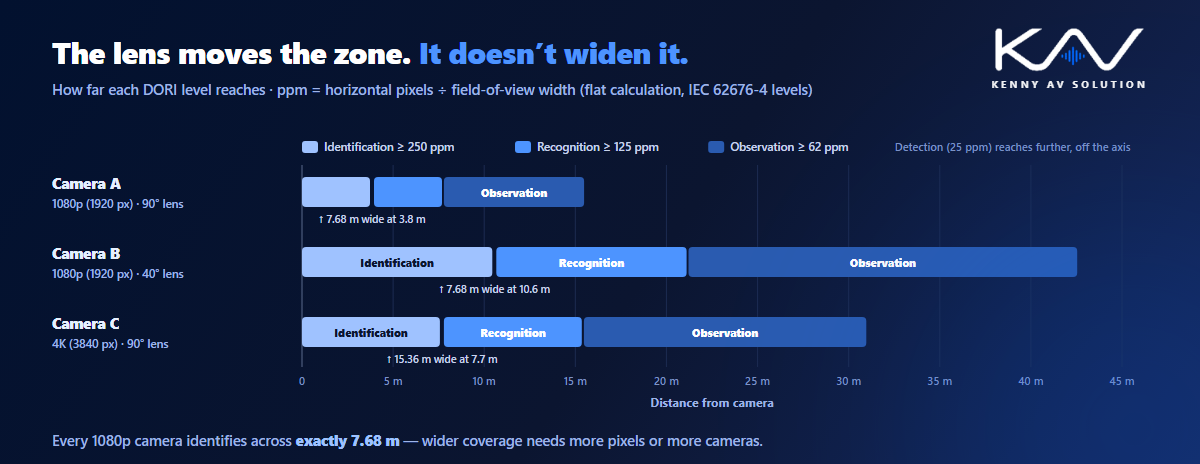
Turn it around and the consequence is striking. For a given resolution and level, the width of view is fixed. A 1920-pixel (1080p) camera at Identification — 250 ppm — sees exactly 7.68 m wide at the point where it identifies, whatever lens it has. A wide lens gets there close to the camera; a narrow lens gets there further away. The lens decides where the 7.68 m falls, not how wide it is. To identify across a wider area, you need more pixels or more cameras.
That is why a coverage drawing should show each camera’s bands — the distances at which it stops achieving each level — rather than a single cone.
Height, tilt and the zone under the camera
The simple formula assumes the target is straight ahead at the camera’s height. Real cameras are mounted high and tilted down, so the true distance to a face is longer than the distance measured on the plan, and pixel density on the target is lower than the plan suggests.
Mounting high also creates a dead zone directly beneath and in front of the camera, which the camera cannot see at all. Its depth depends on the mounting height, the target height, the tilt and the vertical angle of view. A camera mounted too high over a door can miss a face entirely and capture only the top of a head.
Design tools that model height and tilt, such as dedicated CCTV design software, account for this, and their figures will differ from a simple plan calculation — sometimes by a lot. State on the drawing which method the bands come from, the mounting height, the tilt and the target height used, so the result can be checked. Mounting heights belong on the plans and elevations like any other device; see wall elevations and mounting details.
Draw duty zones, not cones
A good CCTV coverage plan shows, for each camera:
- The camera tag, position, mounting height and direction.
- The bands for each level, drawn to scale and cut by walls and obstructions that actually block the view.
- The duty written next to it, with the target it serves.
- The dead zone where it matters, such as under a camera covering a doorway.
Only model obstructions that really block a camera — walls, columns, tall shelving — and leave out the rest, or the drawing becomes unreadable. Build the plan on a correctly scaled and locked architectural background; see working with architectural backgrounds. On existing buildings, check sightlines on the site survey; a camera position that looks perfect on plan is often behind a sign or a light fitting.
The camera schedule and the head-end
The plan shows where cameras are. The schedule and the head-end drawings show what they are and how they connect.
A camera schedule lists every camera with its tag, location, mounting height, tilt, lens or angle of view, resolution, duty and the pixel density achieved at the duty distance, along with its power class and network switch port. The head-end drawings show the recorders or video management servers, the network switches and how cameras reach them, in the same way as AV over IP network diagrams; the security of that network is covered in AV network security documentation.
Two numbers belong on the head-end sheets. The power budget — cameras are usually powered over the network cable, so the switch has to supply them all, with heat to match; see rack power and heat load. And the storage, which follows from the bitrate, frame rate, number of cameras, recording schedule and retention period agreed with the client. Each camera cable gets an ID on the cable schedule like any other run.
Check it as an image, not a number
Pixel density is a proxy for what the camera can actually show. Where the design tool can render a view at the camera’s real resolution, look at it: if you cannot read the face or the number plate the camera exists to capture, the ppm figure does not matter. On site, the same check is made with the installed camera during commissioning and verification, against the duty written on the drawing.
Specialised duties such as number-plate recognition and face recognition need more than a ppm figure: they also limit the angle between the camera and the target. Treat those as separate, stricter criteria.
What a CCTV drawing set contains
- Agreed criteria: the standard, the levels used and the method of calculation.
- A coverage plan with each camera’s bands, duty, height and direction.
- A camera schedule with lens, resolution, tilt and achieved pixel density.
- Head-end and network diagrams for recorders, switches and storage.
- Power and storage figures agreed with the client.
- Mounting details and heights.
- A cable schedule with an ID for every camera run.
- Privacy notes where views need masking.
Frequently asked questions
What does DORI mean in CCTV? Detection, Observation, Recognition and Identification — levels of image detail defined in IEC 62676-4 (2015) by pixel density on the target: 25, 62, 125 and 250 pixels per metre respectively. They describe what an operator can tell from the image, from seeing that someone is present to identifying a stranger.
How do you calculate pixel density for a CCTV camera? Divide the camera’s horizontal resolution in pixels by the width of its field of view at the target, in metres. A 1920-pixel camera whose view is 7.68 m wide at the target delivers 250 pixels per metre. Design tools that account for mounting height and tilt give lower, more realistic figures than this flat calculation.
Does a narrower lens give better identification? It moves the identification zone further from the camera, but it does not make it wider. For a given resolution and pixel density, the width of view is fixed. To identify across a wider area you need a higher-resolution camera or more cameras.
What should a CCTV coverage drawing show? Each camera’s position, mounting height, direction and duty, with its coverage bands for each level of detail drawn to scale and cut by walls and real obstructions. It should state the standard and the calculation method used.
What is a CCTV dead zone? The area directly beneath and in front of a high-mounted camera that it cannot see. Its size depends on the mounting height, the target height, the tilt and the vertical angle of view, and it matters most where a camera covers a doorway.
Need CCTV coverage drawings drafted?
Kenny AV Solution drafts CCTV documentation alongside AV for integrators and security contractors worldwide — camera coverage and field-of-view plans with duty bands, camera schedules, head-end and network diagrams, mounting details and cable schedules, drawn to your standards and your title block. Send us the floor plans, the camera list and the criteria. See our drafting services, grab the free AV CAD Drafting Standards Checklist, or schedule a quick call — we come back with a quote and timeline within one business day.